Debugging Vagrant Hosted PHP through Sublime
Published on
March 16, 2017
By Seth
Back-End Developer
It’s no secret – I’m a fan of Sublime Text. It’s my tool of choice for development. It’s lightweight, fast, good at managing projects, and has a host of utilities that make coding and general text manipulation a breeze. Its user interface is clean and uncluttered. Of course, primarily being a text editor, it’s a little feature-deficient out of the box, but its functionality is extremely extensible via plugins.
One thing that’s useful to any developer is debugging tools. When you stumble across a problem or something that just didn’t behave the way you expected, it helps to get to the root of the problem and really analyze the operation during execution. The Xdebug extension for PHP provides some useful tools to dive into the execution, see variables in scope, and set watches and breakpoints.
Wouldn’t it be helpful to do this right from your workspace in Sublime? Well…you can. I’m going to run through setting up a debugger, connected from PHP running on a Vagrant instance.
Getting Set Up
A Few Notes
I’m not going to go into too much detail here; there are various ways this could be done, and it largely depends on the OS and release packages in play. I’m running on CentOS 6.8, Apache, PHP, and I’m using the Webtatic YUM Repository to install the PHP packages; you can add it with the following:
rpm -Uvh https://mirror.webtatic.com/yum/el6/latest.rpm
The PHP packaging I’m using for this PHP install is php56w. Your mileage may vary.
I’m going under the assumption that you’re familiar with Vagrant, you already have an install, and you have your webserver and PHP operational.
Installing and Configuring Xdebug on the Vagrant Machine
Install the PHP Xdebug module first. Connect to the vagrant box using SSH.
vagrant ssh
Next, install the PHP Xdebug extension.
sudo yum install php56w-pecl-xdebug
There’s a bit that we need to add to the Xdebug configuration to get things going. In CentOS, there’s a .ini file located in /etc/php.d/xdebug.ini. In your flavor of OS, it may be necessary to add this to your php.ini file, as a new [xdebug] section.
; Enable xdebug extension module
zend_extension=/usr/lib64/php/modules/xdebug.so
xdebug.remote_enable=1
xdebug.remote_handler=dbgp
xdebug.remote_host=10.0.2.2
xdebug.remote_port=9000
xdebug.remote_log=/var/log/xdebug/xdebug.log
Essentially, we’ve enabled remote debugging, logging, and we’ve set the handler and network. We’re setting the remote host to the VirtualBox internal network IP 10.0.2.2.
After all this, be sure to restart your web service.
sudo service httpd restart
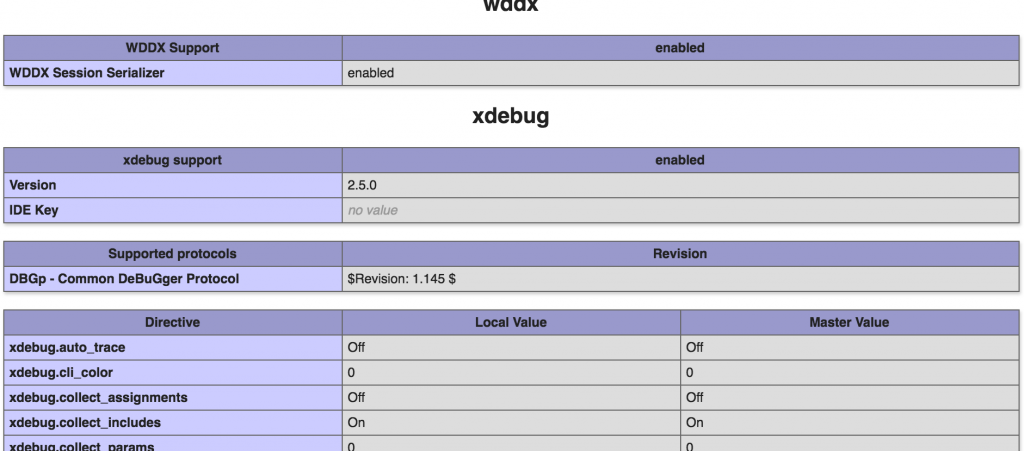
You should be able to check if Xdebug is in use and the configuration by using the phpinfo() method in a script.
Install the Sublime Xdebug Client
First, if you haven’t installed Package Control in Sublime, do so. Check out the instructions here to get up and running with your version of Sublime.
Next, in the Sublime menu, go to Tools, Command Palette. In the Command Palette, run:
Package Control: Install Package.
You can type “pci” to find the item more quickly.
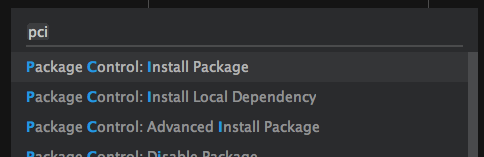
Select the “Xdebug Client” from the list to install. After a moment, the status at the bottom-left of Sublime should indicate it’s now installed.
Enabling and Using Xdebug With Your Project
Configuring the Project
Now that our installation is complete, we need to configure the project for the Xdebugger. If you haven’t made a Sublime project file for your project, do that in the menu, under Project, Save Project As. It may also be a good time to add any folders you need to the project and open the sidebar for quick navigation, if you so choose.
In the Sublime menu, go to Project, Edit Project. We’re going to add a few things:
{
    "folders":
    [
        {
             "path": "."
        }
 ],
 "settings":
 {
     "xdebug": {
         "path_mapping": {
              "/www/sites/sample" : "/Users/user_folder/www/sample",
          },
          "url": "http://sample.dev"
      }
  }
}
Note the “settings” section. We’re adding the “xdebug” key with two crucial things:
- The
path_mappingkey allows us to associate the code path on the vagrant machine with the code path for this project on the local machine. It’s important that this is set, as Xdebug may not run. - The
urlkey tells the Sublime Xdebug plugin the URL of the site. This will likely be different for your setup. If your Vagrant is set for local networking only, it should be localhost and the port forwarding number specified in your provision file.
Save the project file, and we should be ready to go.
Using the Debugger
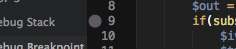
Let’s start by setting a breakpoint. After opening a PHP file – your index.php is a quick place to test – choose a line, and let’s set a breakpoint. After clicking the line, right-click, and from the context-menu choose Xdebug, Add/Remove Breakpoint. You should see a mark to the left of the code line, indicating that the breakpoint is now active.
Now, go to the Sublime Menu, and select Tools, Xdebug, Start Debugging (launch browser).
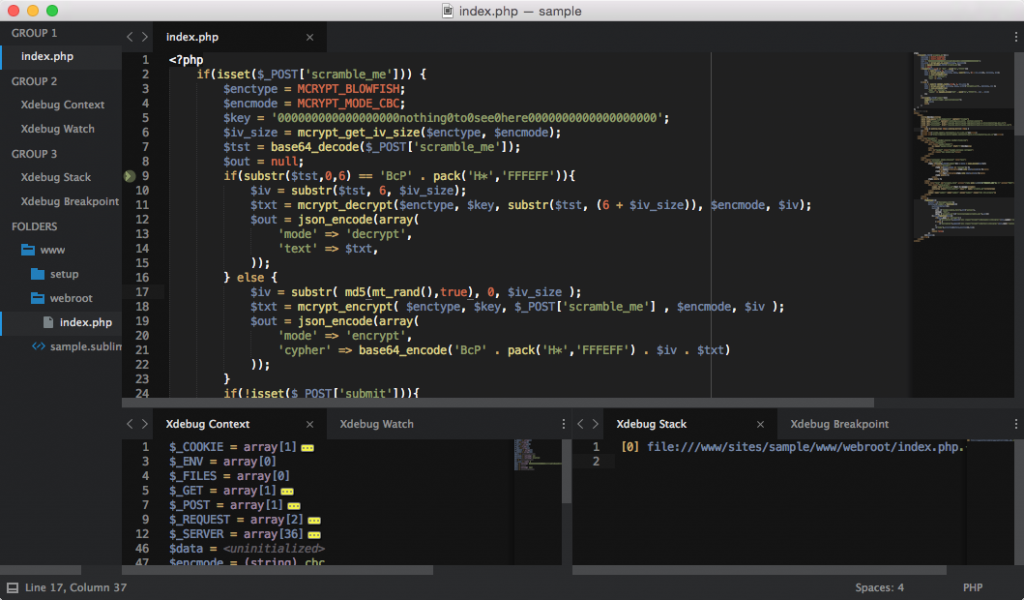
It will have opened the browser to the URL set in the project setting, and if all’s configured correctly, you should notice it’s stopped on the breakpoint. Two new panes are opened, giving you the variables in context, a watch list, stack, and breakpoint list.
Opening the address in the browser also sets a session variable that keeps the debugger enabled. You can turn this off from the Sublime, Tools, Xdebug menu.
So, now that we’re all set up, you have the ability to step in/out through the code, quickly check variables, set up watches and breakpoints, and generally debug as you see fit.
Be sure to check out the Xdebug Documentation and the Sublime Xdebug Client Github project pages for a full set of documentation and options.
TL;DR
Resources
Xdebug Debugger Client for Sublime Text 2 and 3
GitHubPackage Control Installation
packagecontrol.ioWebtatic YUM Repository
WebtaticXdebug Extension for PHP | Documentation
Xdebug